
In the world of process orchestration, a recurring question emerges: Are the models we produce unnecessarily complex? This question matters because overly complex models can lead to several challenges. They are harder to understand, maintain, and adapt—factors that could directly affect project timelines and outcomes. While modern workflow engines, such as Flowable, are fully capable of handling complex models with ease, there are significant benefits to simplifying this complexity. Simplified models improve readability, reduce maintenance effort, and enhance collaboration, making them valuable assets in any organization's toolkit. Thus, the focus should be on designing models that balance functionality with simplicity, ensuring long-term efficiency and usability. To illustrate this, consider a typical use case: calculating capital gains tax for equity investments. The rules are straightforward:
For long-term capital gains:
Gains exceeding $100,000 are taxed at a flat rate of 10%.
Gains below $100,000 are tax-exempt.
For short-term capital gains:
Gains are taxed at a flat rate of 15%.
A modeler new to the field might approach this with a Business Process Model and Notation (BPMN) diagram containing multiple gateways and tasks, as seen in the first diagram.
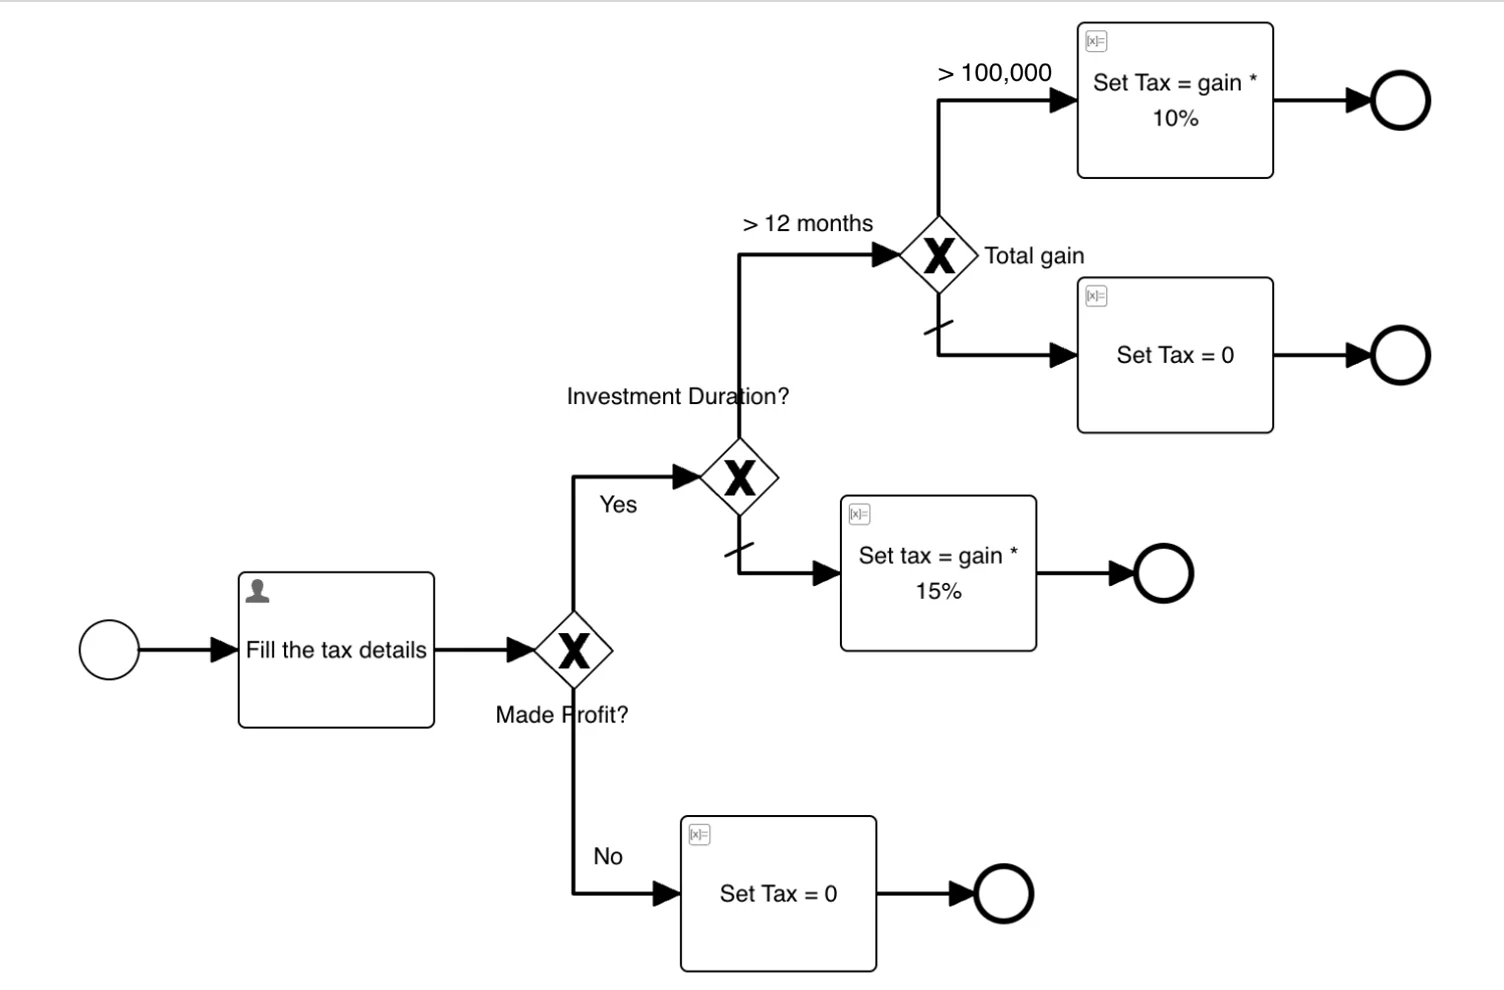
Figure 1: [Option A] Calculate Capital Gain Tax Process
However, an experienced modeler might simplify the same use case using a Decision Model and Notation (DMN), consolidating decision logic into a single task.
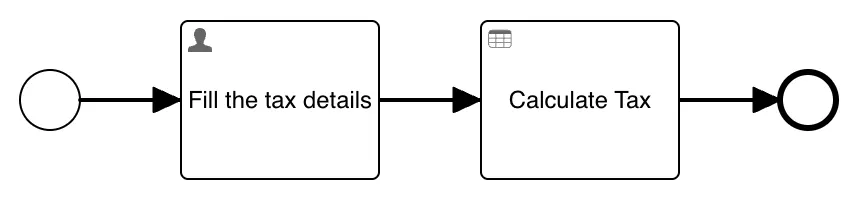
Figure 2 : [Option B] Calculate Capital Gain Tax Process
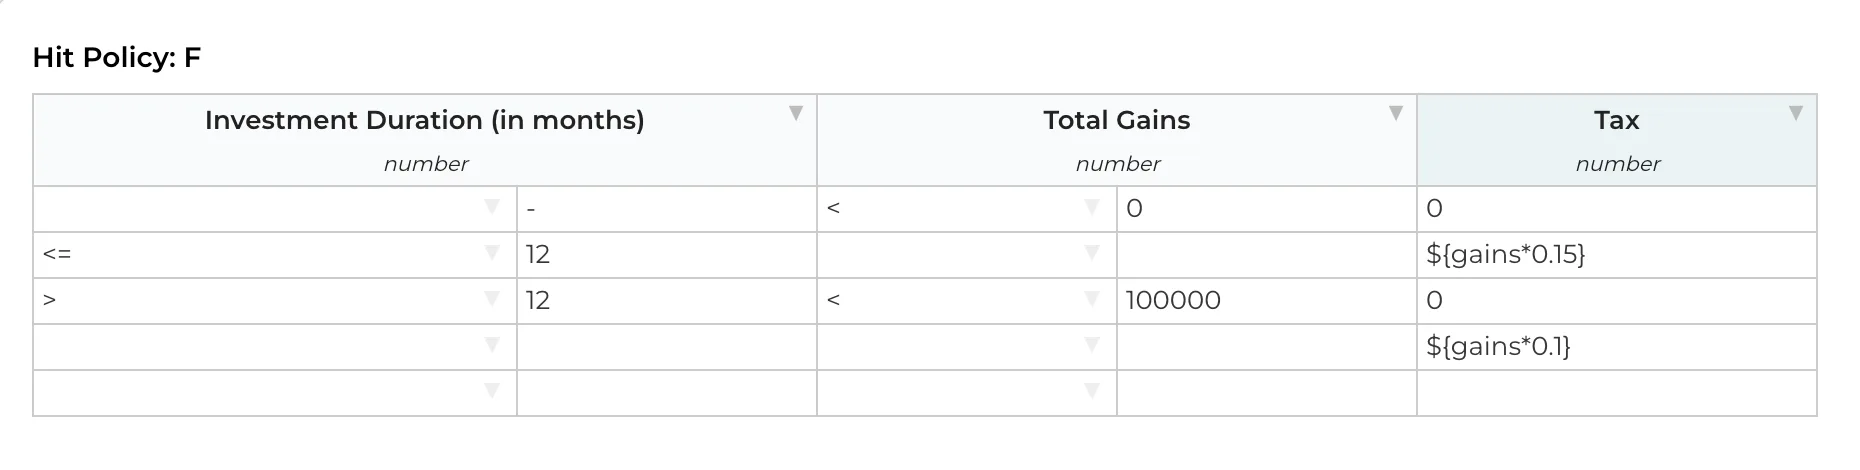
Figure 3 : Capital Gain Tax Decision Table
Analysing these two diagrams highlights key differences:
Number of Activities:
The first diagram contains more tasks, including initialization and human tasks.
Decision Paths:
It introduces multiple decision gateways, increasing the model's complexity.
This is akin to coding practices. The initial diagram resembles nested if-else statements, while the simplified version behaves like a concise function call. If static code analysis tools like SonarQube would exist for BPMN, they would likely flag the first diagram for high cyclomatic complexity, indicating a model with too many execution paths.
Understanding and measuring complexity is crucial for identifying models that need improvement. Overly intricate diagrams can confuse new team members and slow down onboarding. As we emphasize keeping methods in code under 20 lines for clarity, BPMN models should aim for brevity and logical segmentation.
A practical approach to reducing complexity includes breaking down large BPMN diagrams into smaller, manageable sub-processes or call activities. The goal is not only to model workflows but to provide a clear, understandable abstraction. Whether through BPMN or CMMN, models should serve as tools to communicate processes effectively rather than overwhelm stakeholders.
In conclusion, striving for simplicity in workflow modeling aligns with broader goals of efficiency, clarity, and maintainability — key drivers of successful process automation and optimization.
While much of the focus has been on why complexity needs to be assessed, the more pressing question is how to measure it. The answer varies depending on the context and objectives. For instance, if the goal is to identify models suitable for simplification, complexity could be defined by models with oversized diagrams, repetitive flows, or inefficient use of constructs. Conversely, a BPMN SaaS provider might define complexity in terms of models with numerous I/O operations or compute-intensive tasks. To others, complexity may stem from deeply nested processes, extensive use of new modelling features like data dictionaries, dashboards, or intricate conditions.
Complexity, therefore, is subjective, shaped by the specific aspects of a model under evaluation. To establish a clearer narrative, we define complexity based on structural and behavioral factors that make models harder to understand and maintain.
From this perspective, certain characteristics commonly indicate complexity:
Multiple Execution Paths:
Models with numerous decision points or sequences.
Gateway Usage:
Inclusive gateways are generally more complex than exclusive or parallel ones, given their potential for multiple sequence flows.
Nested Models:
Models with deeply nested structures pose greater challenges.
Variable Volume:
Models with an extensive set of variables, such as in insurance processes, are inherently more complex than simpler workflows like leave approvals.
CMMN Decorators:
Features like auto-execute, sentries with conditions, and decorators increase complexity.
Interconnected Models:
Reusing models across workflows promotes maintainability, but excessive dependencies can introduce complexity. When a model is referenced by many others, updates and changes require careful coordination to prevent unintended impacts.
And Beyond:
Other characteristics can be added depending on the specific context.
Once complexity is defined, the next step is quantification. Fortunately, decades of research provide a foundation. While BPMN, being more established, has a rich body of metrics, CMMN research is relatively nascent. However, at Flowable, we have many customers running CMMN, allowing us to leverage a wealth of real-life use case data. By synthesizing existing research with these practical insights and adding new criteria, comprehensive complexity analysers can be built. Below is an overview of relevant metrics used to evaluate model complexity.
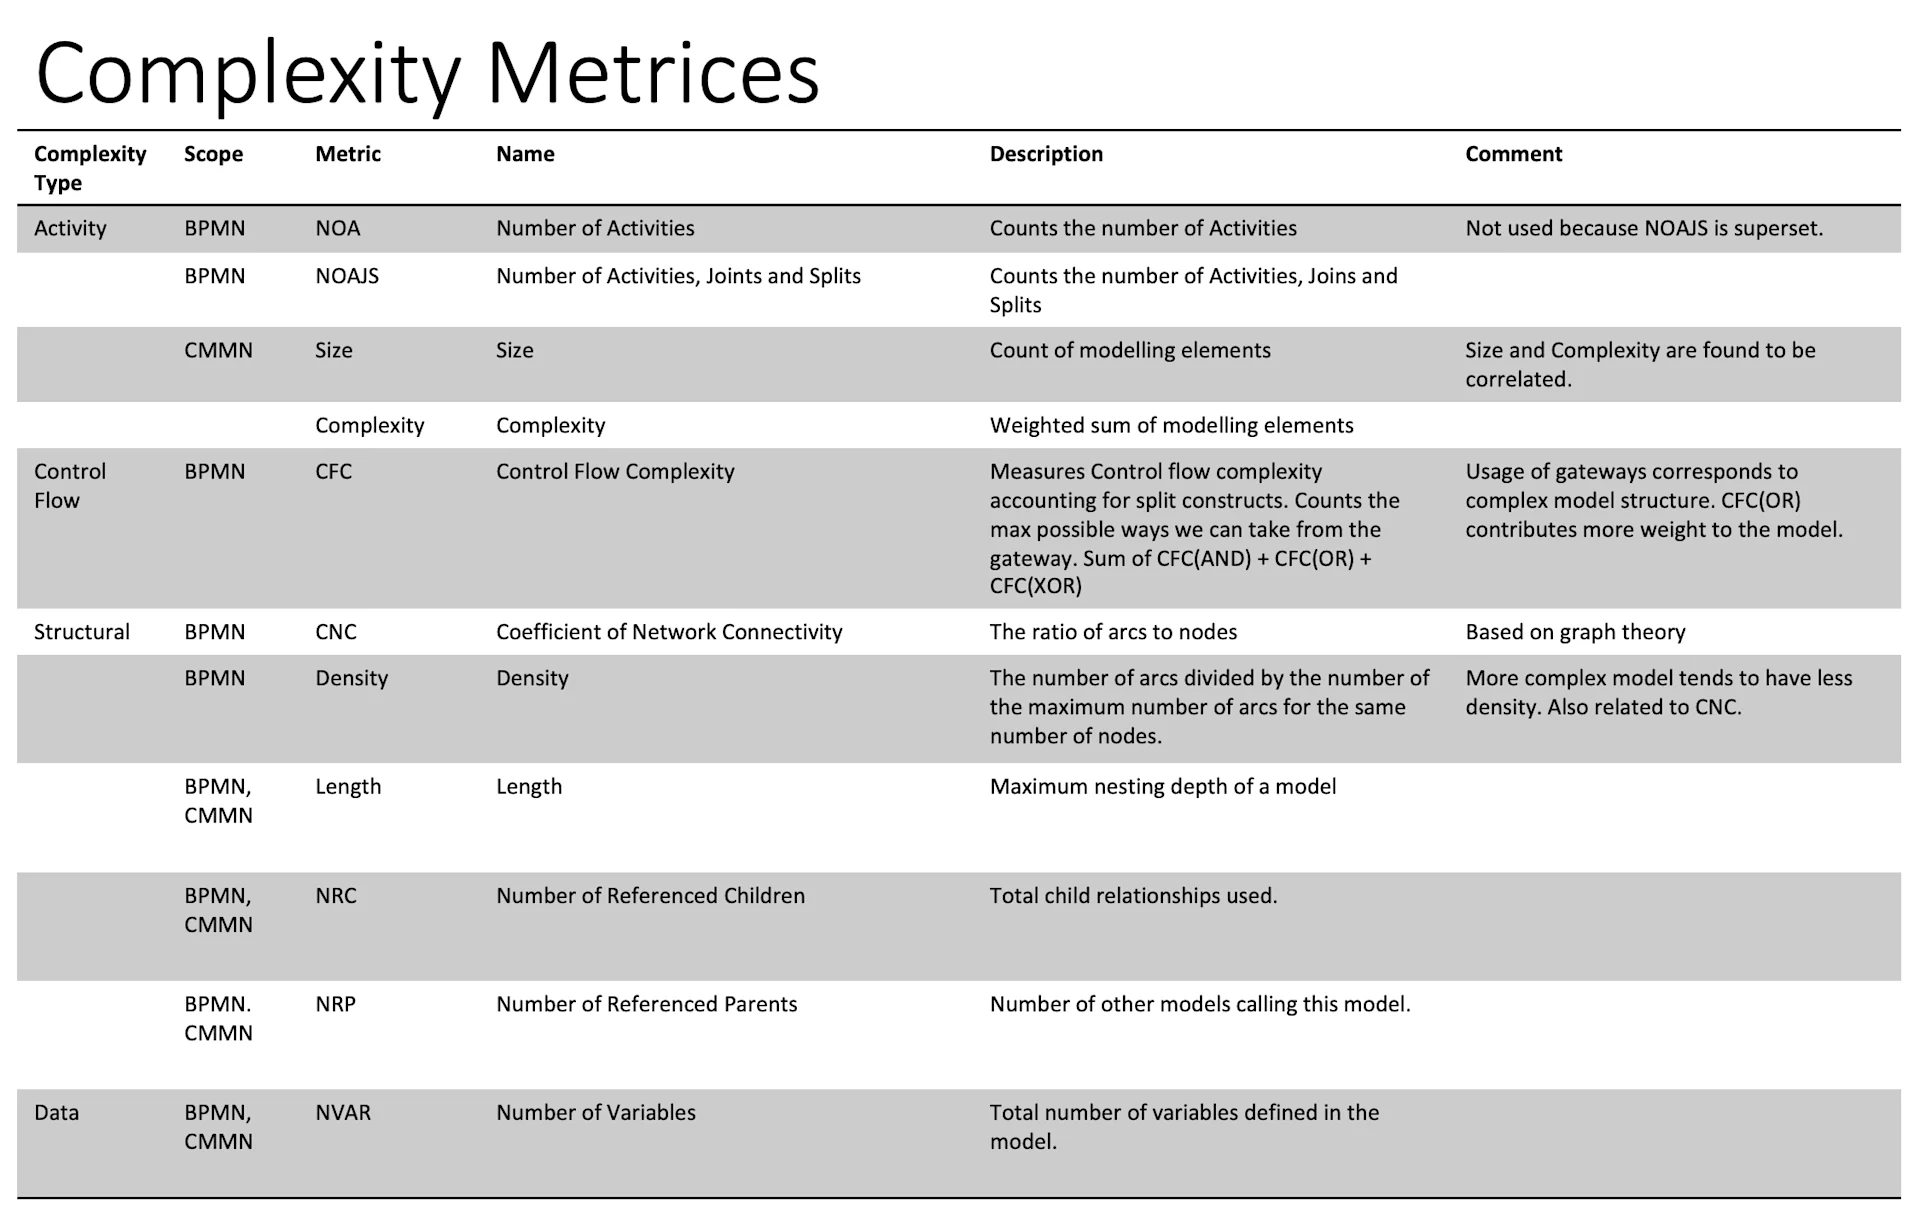
Figure 4 : Complexity Metrics
To better understand complexity in workflow modelling, various metrics can be categorized based on different aspects of the model. Using examples like the “Loan Case” or “Approval Process,” these metrics offer insight into a model's structure, control flow, and data complexity.
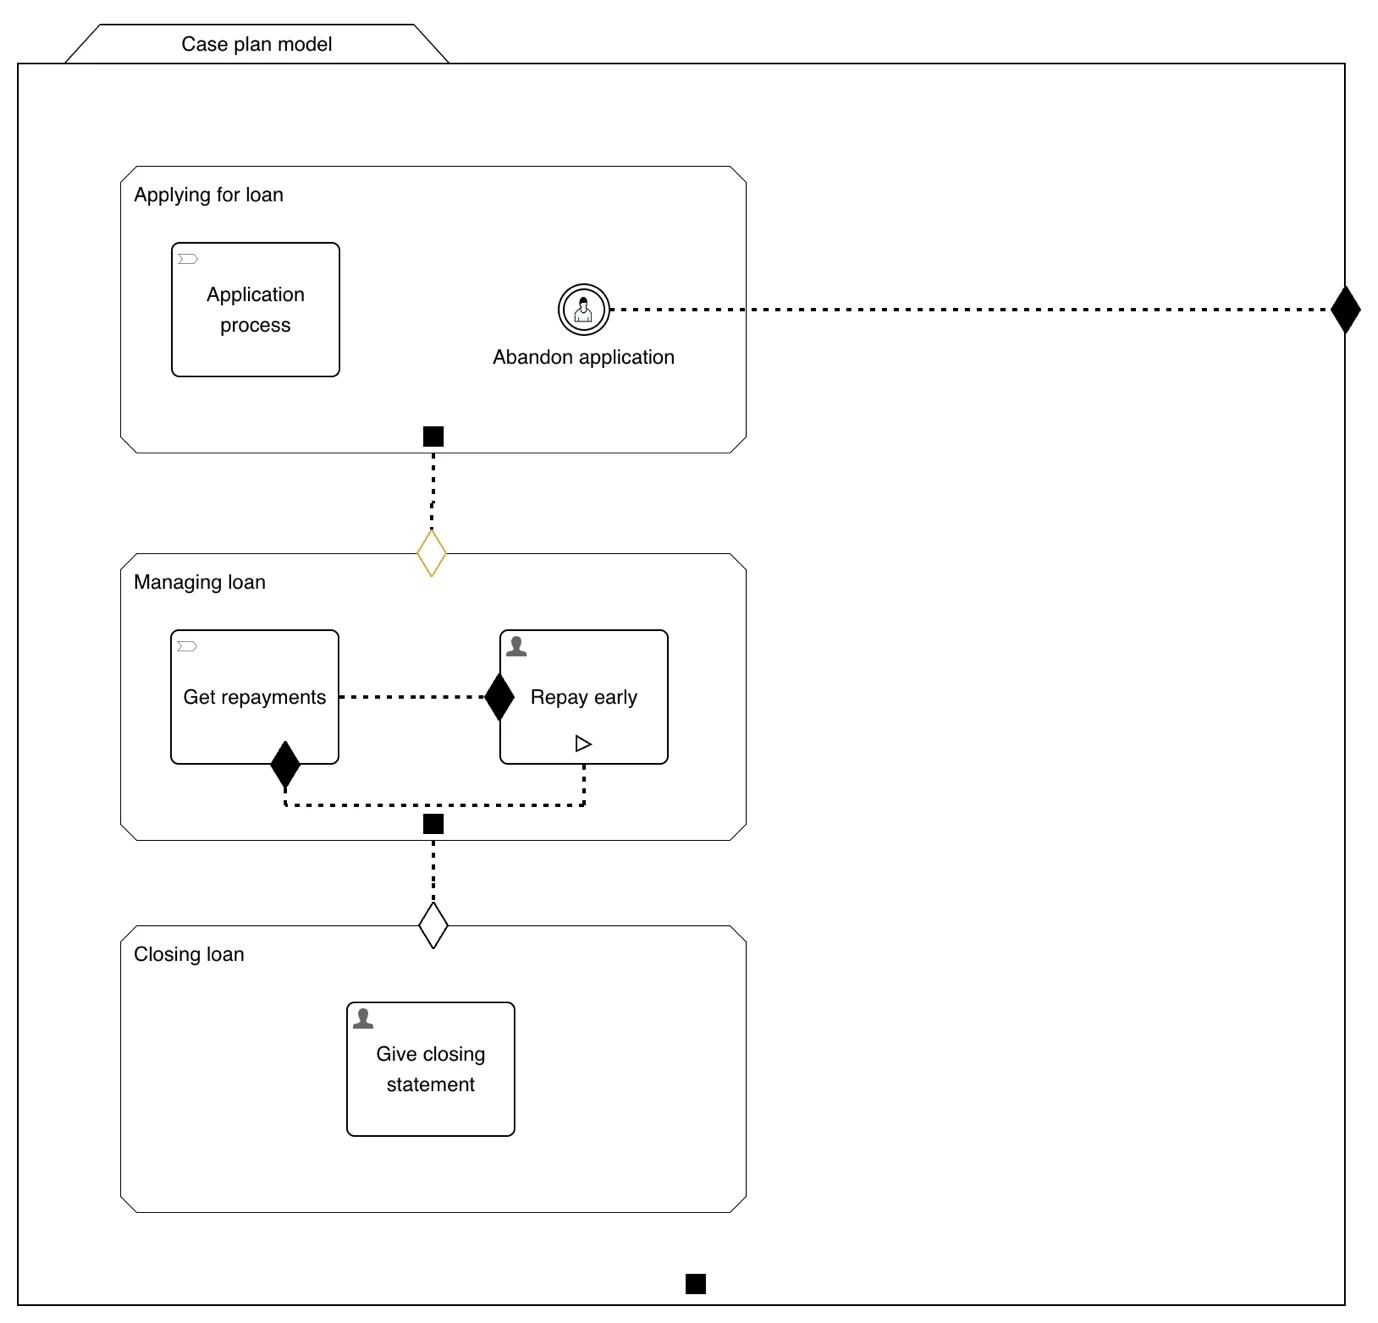
Figure 5 : Loan Case
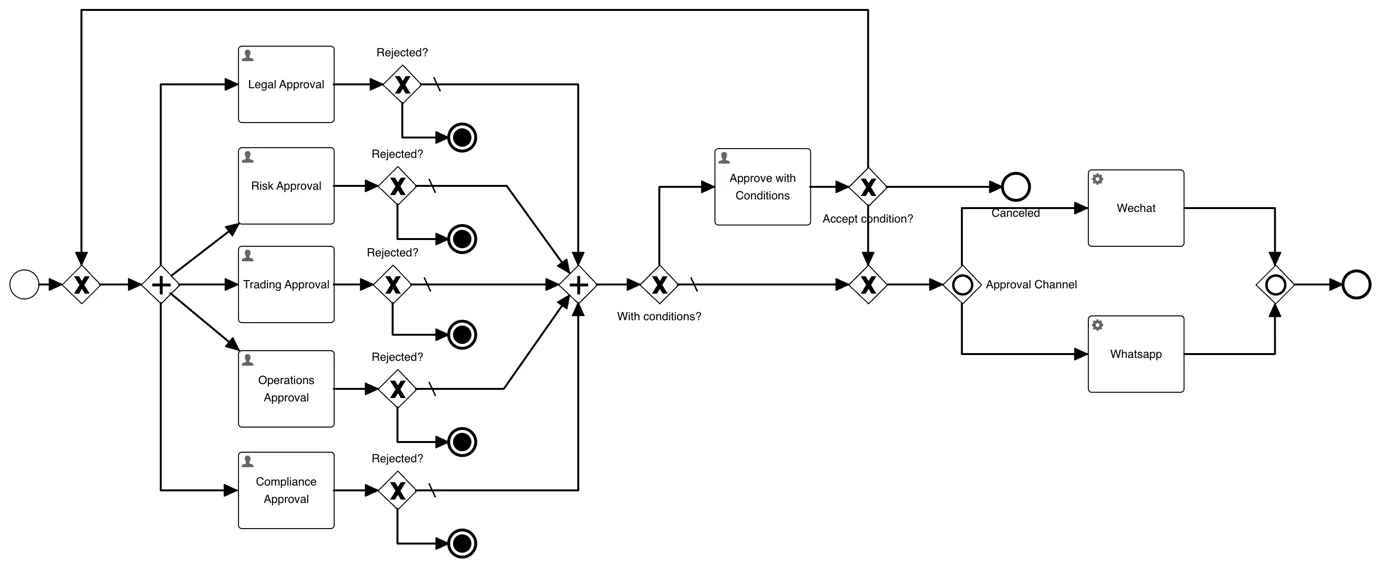
Figure 6 : Approval Process
Based on which aspect of model you consider; we can divide them into 4 larger categories
These metrics evaluate the elements within a model, providing a snapshot of its internal composition.
Number of Activities (NOA): Measures the count of activities in a BPMN model. For instance, the “Approval Process” contains 8 activities: 6 human tasks and 2 service tasks.
Number of Activities, Joins, and Splits (NOAJS): Extends NOA by including sequence flows and gateways, offering a more complete metric. The “Approval Process” has a NOAJS of 21.
Size (CMMN): Similar to NOA but applied to CMMN. It counts all plan items, yielding a size of 14 for the “Loan Case.”
Complexity (Weighted): Assigns different weights to elements based on their complexity. For instance, sentries with conditions might be weighted higher than simple process tasks.
This group focuses on how control passes from one element to another. Like for gateways, how many possible paths are possible if you leave the gateway.
CFC(AND) – Control Flow Complexity for AND (Parallel) gateway. For any parallel gateways, the behavior is always the same, that is executing all the sequence flow coming out of it. CFC(AND) is then count of all parallel gateways. For “Approval Process”, it is 1+1=2.
CFC(XOR) – Control Flow Complexity for XOR (Exclusive) gateway. For an exclusive gateway, based on condition, only one flow can be active at a moment. So, you end up with number of Fan Out (Sequence flows coming out of it) possible execution paths. Hence CFC(OR) of a gateway is equal to Fan Out of the gateway. For “Approval Process”, it is 1+2+2+2+2+2+2+3+1=17.
CFC(OR) – Control Flow Complexity for OR (Inclusive) gateway. For an inclusive gateway, multiple sequence flows can be active at a moment, based on which conditions evaluates to true. Which bring down the possible execution paths to 2^(Fan Out )-1. For “Approval Process”, it is, 3+1=4.
CFC – Control Flow Complexity, is sum of all the above CFC subsets. Hence final CFC score of “Approval Process” is 2+17+4=23.
Structure metrics focuses on overall arrangement of the modelling elements. Most of the metrics are based on mathematical study of graph and tree theories. If you look at BPMN, it’s easy to correlate with graphs, as activities, events and gateways representing nodes of graph, and sequence flow representing edges.
The execution tree of BPMN is nothing but an inverted tree. And the children are created using call activities.
Density – It’s a ratio of nodes (activities/gateways/events) by maximum number of arcs (sequence flows) possible. Mathematically it’s a result of arcs/nodes*(nodes-1). The denser the model is, the less readable it is, as you will see more web of arcs in the model. For “Approval Process”, density is 0.0431.
CNC (Coefficient of Network Connectivity) – Represents the ratio of arcs to nodes. In the Loan case, this is 1.2068.
Length – Based on tree, it’s a maximum depth of model. For BPMN, it can be how many levels sub-processes or sub-cases can go. In CMMN, you also consider sub-scoping inside the stage or plan fragment along with process and case tasks. The length of “Loan Case” is 3.
NRC (Number of Referenced Children): Counts the models referenced by the current model.
NRP (Number of Referencing Parents): Counts the models that reference the current model.
Data handling is an integral part of BPMN and CMMN models. In Flowable, the orchestrations can store information traditionally via variables, or in a more structured way by using data objects. Complex models often involve intricate data structures.
NVAR (Number of Variables): Measures the count of variables in a model, reflecting its data complexity.
These metrics provide a foundation for quantifying workflow complexity. By applying them, models can be evaluated for improvement opportunities, ensuring better readability, maintainability, and performance. Future discussions will delve deeper into building a complexity analyser and applying these metrics to real-world scenarios.
We have now discussed what complexity is, and what factors contributes towards it. In the next part of the blog series, we will delve deeper into building a complexity analyser and applying these metrics to real-world scenarios.

Flowable Solutions Architect
Prathamesh is a Solutions Architect at Flowable, helping customers design, implement, and optimize intelligent automation solutions. With deep expertise in BPMN, CMMN, and DMN, he bridges technical complexity with practical value ensuring Flowable delivers where it matters most.
prathamesh.mane@flowable.com

Tools like ChatGPT can handle a variety of business tasks, automating nearly everything. And it’s true, GenAI really can do a wide range of tasks that humans do currently. Why not let business users work directly with AI then? And what about Agentic AI?

In this post, we continue our exploration of workflow complexity - learn how key metrics like activity count and control flow reveal natural groupings of models, making it easier to identify and improve overly complex designs.

In this post, we continue our exploration of workflow complexity - learn how key metrics like activity count and control flow reveal natural groupings of models, making it easier to identify and improve overly complex designs.